1) How do I install the Plot-AI add in?
Signup at https://plot-ai.com. Provide your details, click on the link from your email, and login to account. Download the add-in, install, and activate! Here is a short video.
2) The “Generate Report” button is greyed out. How do I get it to work?
Click on the “Activation” button on the top ribbon within the Plot-AI tab in excel. Check you email for the registration message and copy/paste the activation key.
3) I want to show averages instead of sum in my chart. Where can I change this?
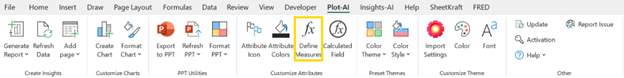
One option is to set global defaults by clicking on “Define Measures” within the Plot-AI ribbon.
The other option is to click on the three dots (…) within the chart and select “change aggregation type” under the Miscellaneous selection.
4) What should I do to create a copy of my current page?
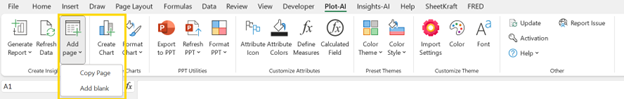
Click “Add Page” within the Plot-AI ribbon and select if you want to copy the entire page with all the charts or create a blank template.
5) How do I add a new chart to my worksheet using Plot-AI?
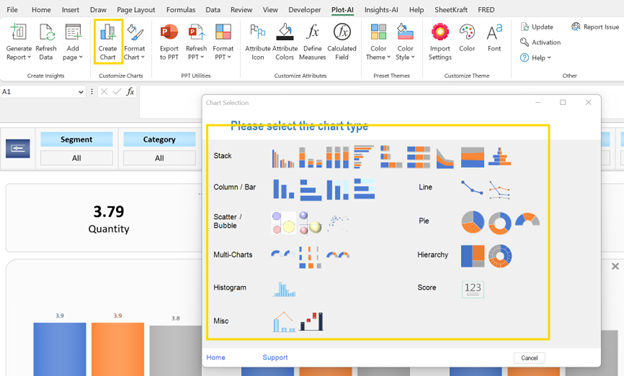
Clicking “Create Chart” will show you a panel of different chart types to select from. Pick one and select necessary dimensions.
6) Can I alter the chart type or the X axis?
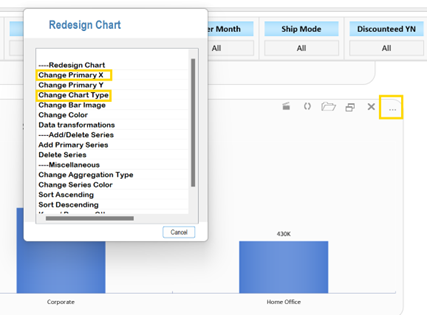
Click on the three dots (…) within the chart, and select “Change Chart Type” or “Change Primary X”. Pick your choice from the next prompt.
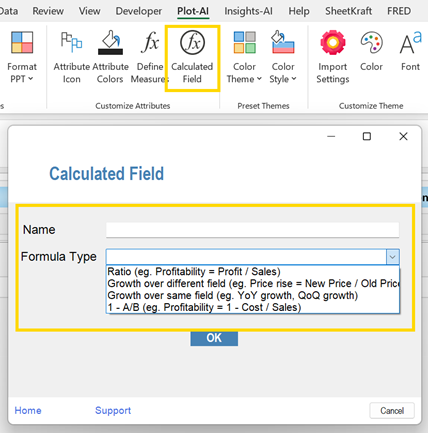
7) How do I create a calculated field?
Plot-AI offers the ability to create simple calculated fields that we frequently use. Click on “Calculated Field” in the top ribbon, enter a name for the new field and select the formula type to get started. The advantage of using this is all aggregation at various levels will auto compute the new field values.
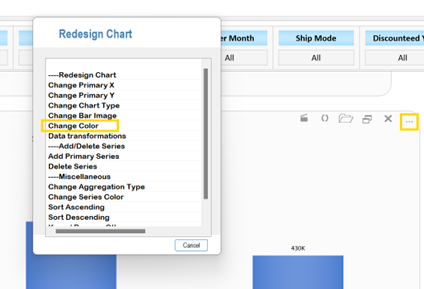
8) Can we color the bars in my bar chart based on a different variable?
This is one of the power features in Plot-AI. Click on the three dots (…) within the chart, select “Change Color”. Pick your choice from the next prompt. Pick the variable of your choice and the number of colors you want.
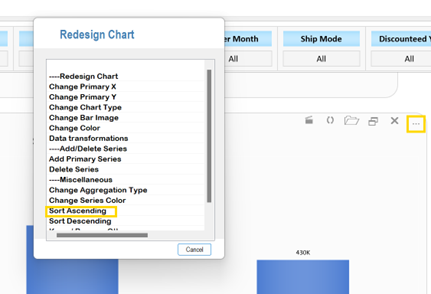
9) What if I wanted to alter the order in which my chart is sorted?
Any series can be sorted in ascending, descending or a custom order of your choice (by values). Click on the three dots and select a sort option.
10) How do I share my analysis?
You can share the polished excel (end users will need to install Plot-AI to use dynamic filters) or publish the analysis to a PowerPoint.
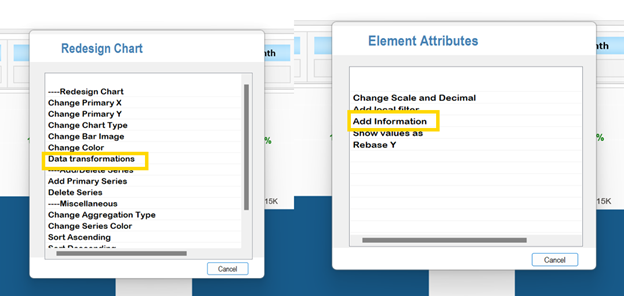
11) How do I add additional information (for example growth rate) as a text box in a chart?
Click on the three dots inside a chart, select “Data Transformations” and then choose “Add Information”. This will then guide you through the selection of additional variables. You will also see prompts for text box type (eg.: no border, rectangular, arrow shaped) and coloring (eg,: red/green, custom colors).
12) Can I add a new series to my chart?
Yes. Start with the three dots, select “Add Primary Series” and then pick a series of your choice. You can also delete a series from a chart similarly.
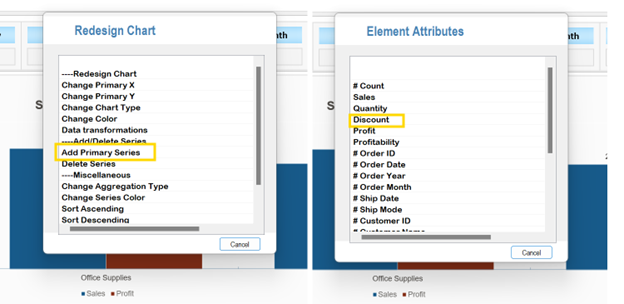
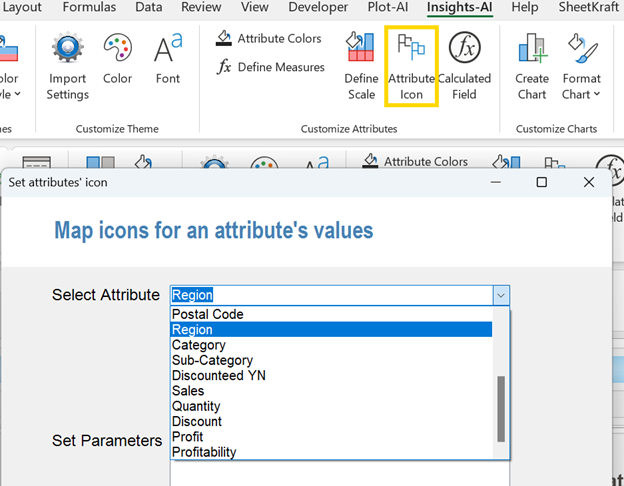
13) I think showing icons instead of values is highly effective. Does Plot-AI enable it?
We get asked this often and allow users to add/display icons in lieu of values. In the top Plot-AI ribbon click on “Attribute Icon” and this should bring up a list of variables to choose from and values to assign icons to. Typically this is a one-time setting and all new charts will show the icons you have chosen for the selected attribute values.
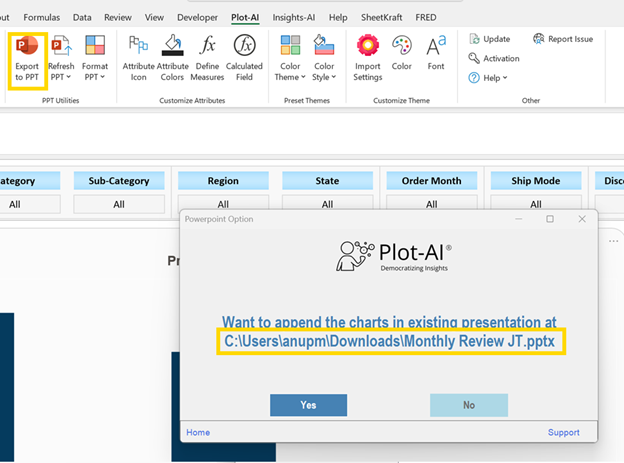
14) How do I export my charts to Powerpoint?
This is where Plot-AI saves significant time and effort for analysts. You can select to export one, multiple (ctrl+click) or all charts from a Plot-AI powered workbook to Powerpoint at the click of “Export to PPT” in the top ribbon. Choose an existing or Powerpoint file or a template (to leverage corporate styling) to append the charts as slides. Plot-AI embeds these as Powerpoint native charts, so you can modify them within the deck if needed.
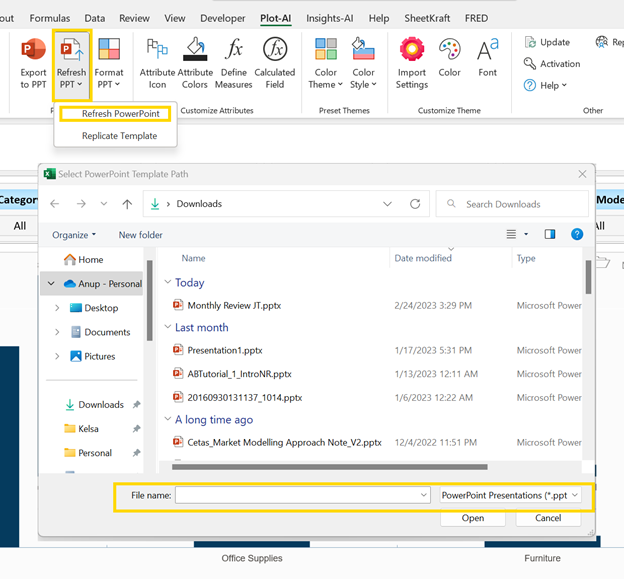
15) My underlying data has changed. How do I update my Powerpoint slides?
Data refreshes are a breeze with Plot-AI. Click on “Refresh PPT” in the top ribbon and point it to the file you want updated. Plot-AI maintains a mapping between the charts in excel and the deck and refreshes all slides in one go. This is a power feature that analysts love.
16) I just added new columns to my underlying data and they don’t appear in Plot-AI. How do I handle this?
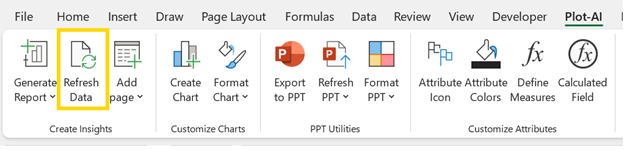
Once you add new rows or columns to an existing dataset, all you need to do is click “Refresh Data” in the top ribbon. New dimensions (columns) or values (rows) should be reflected in your dashboards.
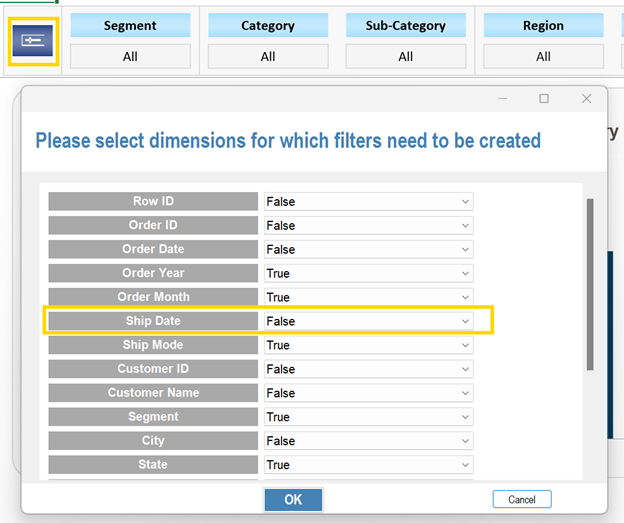
17) The default filters shown are not what I want. How do I change them?
To the left of the filters you see a “Toggle Icon”. Click on it to see a list of all filters and their visibility.
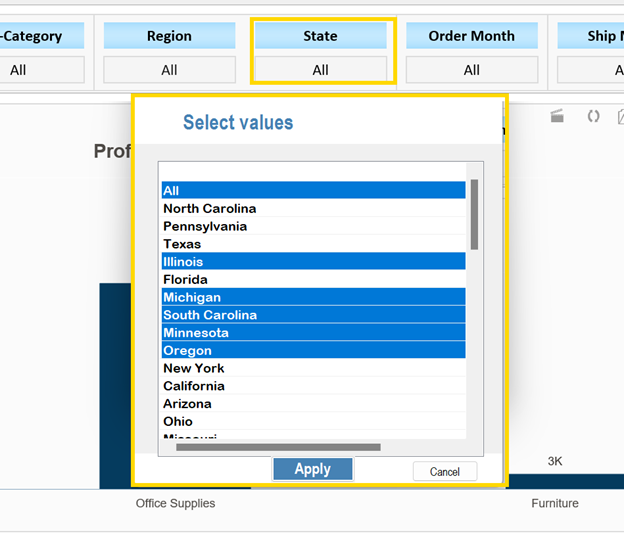
18) How do I select multiple values (i.e. multi-select) in a filter?
Click on the filter you are interested in. Clicking once lets you select one single value and “Ctrl + Click” lets you select multiple values at a time.
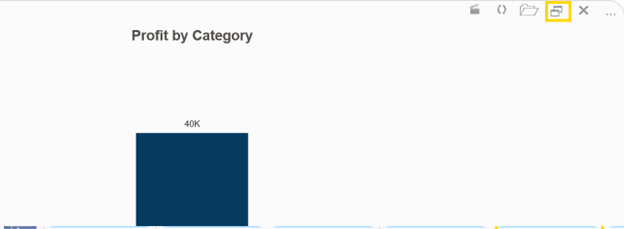
19) Can I copy charts?
While the sub optimal excel copy paste option works, within the chart you can click on the “Copy” icon to create a replica of the chart to the right.
20) Animation is an interesting way to visualize time series data. Can Plot-AI help?
Plot-AI is the only automated solution to enable this within excel. Once you have a chart which you would like to animate (by time, region or something else), click on the “Animate” icon within the chart. This will then prompt you to pick variables to animate over and save the animation as a gif. (Note: Let the animation fully play out in excel to save as a gif. )

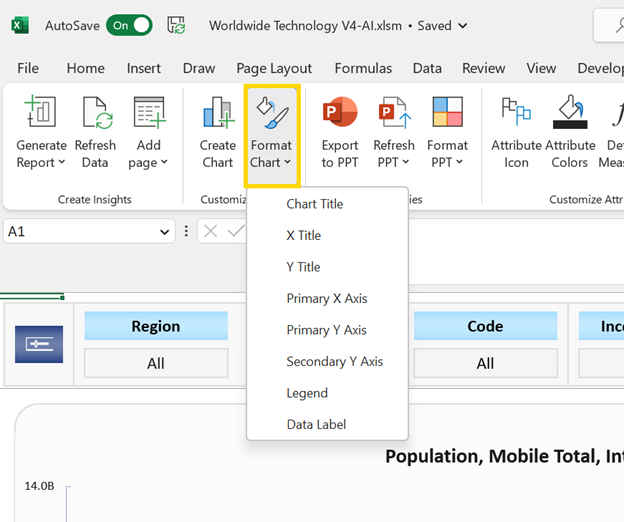
21) I want to hide Y axis labels across all my charts. Is there a global setting for this?
Click on “Format Chart” in the top part of the ribbon to select which element you want to format globally.
22) Is my data secure? What is your privacy policy?
Plot-AI does not store any data on its servers. All of the data is local to your machine/network, so all restrictions used by your organization apply. You can read more about it here .
23) Whom do I contact if I have questions?
Your best bet is to email us at: info@plot-ai.com. We monitor this frequently.